This DEB Numbers post is a continuation of our previous post, here, where we laid out some of the measures of collaboration that are available to us in DEB. If you are new to DEB Numbers posts, we suggest you read our introductory message to familiarize yourself with some of the conventions we use here to describe what can be confusing information.
How many collaborators?
Beyond the presence/absence of PAPPG-defined collaborative proposals or presence/absence of Co-PIs on a project, we have some additional information that may shine a light on other facets of the collaboration question.
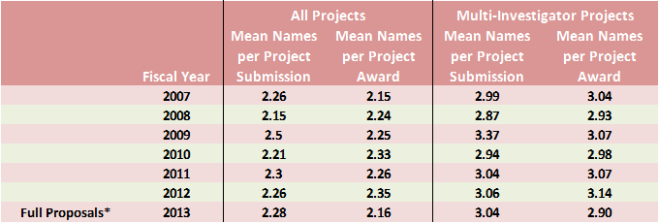
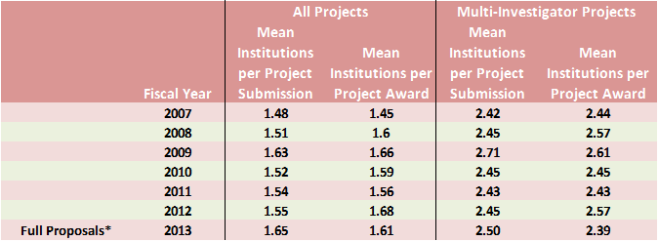
Clearly, an immediate follow-up question to presence/absence of collaboration is “how many are involved?” In answer to this we can take a look at the average number of names on a project’s cover sheet(s) or the average number of institutions on a project’s budget(s). The following tables exclude preliminary proposals because those projects are submitted by single institutions without budget information and so do not reliably provide complete information for persons or institutions. (The Excel template required for January, 2013 preliminary proposals was an attempt to improve capture of such info.)
Mean PI/Co-PI Names on Full Proposal Project Cover Sheet(s) for DEB Core Program Panel Submissions and Awards FY2007-FY2013
Mean Institutions in Full Proposal Project Budget(s) for DEB Core Program Panel Submissions and Awards FY2007-FY2013
*Tentative numbers for FY2013 under the Continuing Resolution budget scenario.
For both mean persons and mean institutions per project submission, we do not see any large change in FY2013 which would signify some sort of catastrophic impact on collaboration habits in project submissions.
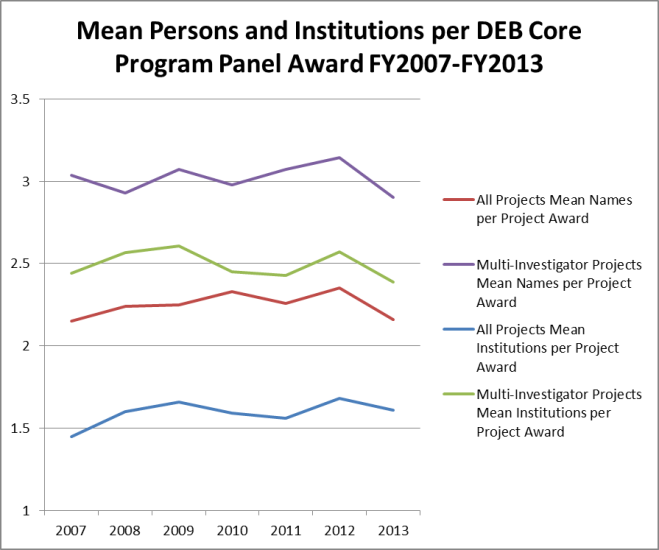
The numbers for both mean persons and mean institutions on the awards, however, may give one pause. Especially if plotted, the visualization can seem frightening:
For all four measures of the awards, FY2013 is down from FY2012. In three of the four cases the FY2013 drop is the largest single year change in the set. Since we saw in the previous post on collaborations that the proportions of single investigator versus collaborative project awards had not changed, this observed change requires that the size of groups involved in collaborative projects expected to be awarded for FY2013 are somewhat smaller than in previous years. How much smaller? Well, the mean changes by ~.25 in the largest drop so we are looking at one fewer participant for every four multi-investigator project awards. This is definitely something we are keeping an eye on but, given the unique circumstances in FY2013, our interpretation is it does not yet signal a problem with the review system but rather a trade-off with the budget.
Such a decrease actually makes sense in the context of a limited and uncertain budget. Especially given the focus on funding rates and maximizing the number of projects awarded, programs have an incentive to spread the available funding over as many projects as possible. Programs also seek balance between multi-investigator and single investigator project awards. If multi-investigator projects with smaller collaborative groups cost less than similar projects supporting larger groups of PIs and Co-PIs, the funds saved on the less costly projects could enable more awards to be made in total.
Inter-generational Collaboration
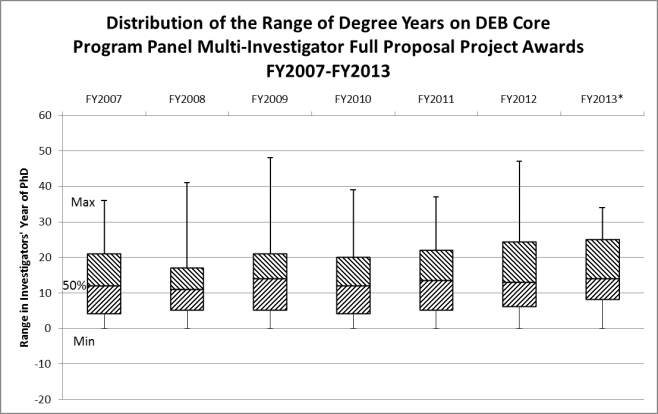
The last measure we will take a look at in this discussion highlights a specific aspect of the collaboration concern that was raised in some quarters, namely that the submission limit would stifle collaboration between younger and older researchers. The best measure we have to look at such inter-generational collaboration is the terminal degree year of the researchers. This number is part of each individual’s FastLane profile. We can capture that data for the participants in each multi-investigator project and calculate the number of years between the most recent and most remote terminal degree years on each project. The distribution of these degree year ranges was compiled for DEB Core Program Panel Multi-Investigator Projects awarded from FY2007 through FY2013. These distributions are presented below, without further commentary, as a series of box-and-whisker plots.
We hope these two posts have started you thinking about collaboration and look forward to continuing the discussion in the comments and future posts.


Looks like there has been a change over time in the range of degree years of investigators. Is this significant? The trend does not look good for younger investigators.
Pingback: Two interesting tidbits from NSF | Prof-Like Substance
So what calculus is the 2 proposal limit per PI based on? What is the expected number of preproposals that would be submitted if the limit were 3 or 4 (i.e., what is the expected cost to NSF in terms of reviewer burden, etc)? Just because the cost of upping that limit is non-zero does not mean that it would not be worth it to do so.
The decrease in mean # of names per award is troubling, and NSF is creating obstacles to scientists who work collaboratively and across disciplines, and hence to collaborative, cross-disciplinary research itself. Barring some bizarre collaborative network topology, that decrease had to happen given the newly imposed PI limit, so I’m not sure why you are arguing that it might just be due to unique circumstances of FY2013.
Like no time in the history of science, I would argue that collaborative science is increasingly necessary from both a conceptual and methodological point of view to tackle problems of basic and applied importance. And yet, many of these ideas are not even being let in the door.
I understand the basic constraints NSF is under and have defended the preproposal process to my colleagues, but the PI limit seems to represent an implicit undervaluation by NSF of projects that might require a range of complementary expertise, when this is something that in my view NSF should be encouraging.
Babakubwa asked about the “calculus” of the 2 proposal per PI limit. Program officers in DEB are trying to fund the best available science while simultaneously managing the diversity of their program portfolios in terms of topics, personnel and a variety of other factors, all within a limited budget.
DEB will fund in the neighborhood of 100 projects in FY13. These were selected from about 1600 pre-proposals and about 150 CAREERS, OPUS, etc. Just focusing on the pre-proposals, suppose we relax the cap and get 2000 or more submissions in FY14. Our current budget plan anticipates we will, again, fund about 100 projects. In both years, many outstanding proposals will not be funded because of a lack of funds. This is the key trade-off: will a substantial number of projects that are better than any of the current 100 or so that can be funded result from the increased cost and effort of allowing PIs to submit more proposals? Moreover, given the limited pool of funding, will DEB programs commonly fund a single PI/co-PI on multiple projects in a single cycle? These are the questions that program officers wrestle with on a regular basis.
A second issue is that while there is a limit on the number of submissions per PI, there is no limit on collaboration. Placing your name on the cover page as a PI (or co-PI; NSF makes no distinction) means that you assume full intellectual and fiscal responsibility for the entire project; if something were to happen to the other PIs, you would still be responsible. Many individuals, including at least some soft money researchers, make significant, but defined, contributions in their particular area of expertise on several projects and cannot take on that level of responsibility for personal or institutional reasons. These are what NSF would consider “Senior Associates”, whose funding should appear in section A, lines 2-6, of the NSF budget, along with the PIs and co-PIs, but NOT on the cover page of the proposal. There is no limit to the number of proposals on which one can be a Senior Associate, nor on the number of Senior Associates that can contribute to a project. Note that there has always been a limit of 5 PIs per proposal. We wrestle with many factors here that we cannot control, including an institutional perception that potentially devalues a funded researcher who is not a PI. There is a lot of diversity of opinion among the DEB community on this; we look forward to further discussion and to our survey results.
In any case, the FY13 data that was published here on April 3 is not complete (we do not have a final FY13 budget yet) and shows a single point that dips slightly below the long-term mean of names per funded project. It’s a small sample, as mentioned above, and a slightly higher number of CAREER or OPUS projects (both, by definition, single investigator awards) could pull that down. Also, we have not counted the number of “Senior Associates” in FY13 or previous years; we do not know if this number has increased due to the pre-proposal process. We will be looking for a more sustained trend before we draw any conclusions about the PI cap limiting collaboration.
Technical Detail: Collaborators who are not co-PIs should be entered on a proposal using “Add/Delete Non Co-PI Senior Personnel” when submitting in FastLane. This allows you to submit a biosketch and a current and pending form for them. If (and only if) they are going to be paid something, they should also be included on the Budget page in Section A, lines 2-6.
Pingback: DEB Numbers: Preproposals and Collaboration, Part 1 | DEBrief
I would like to see these stats broken down by panel. Different subdisciplines within DEB have very different cultures of collaboration. I would be interested to know, in particular, how this transition has affected ecosystems proposals – with our long history of multi-investigator research projects.
Pingback: DEB Numbers: Award Size and Duration | DEBrief
Pingback: DEB Numbers: FY2013 Wrap-Up | DEBrief